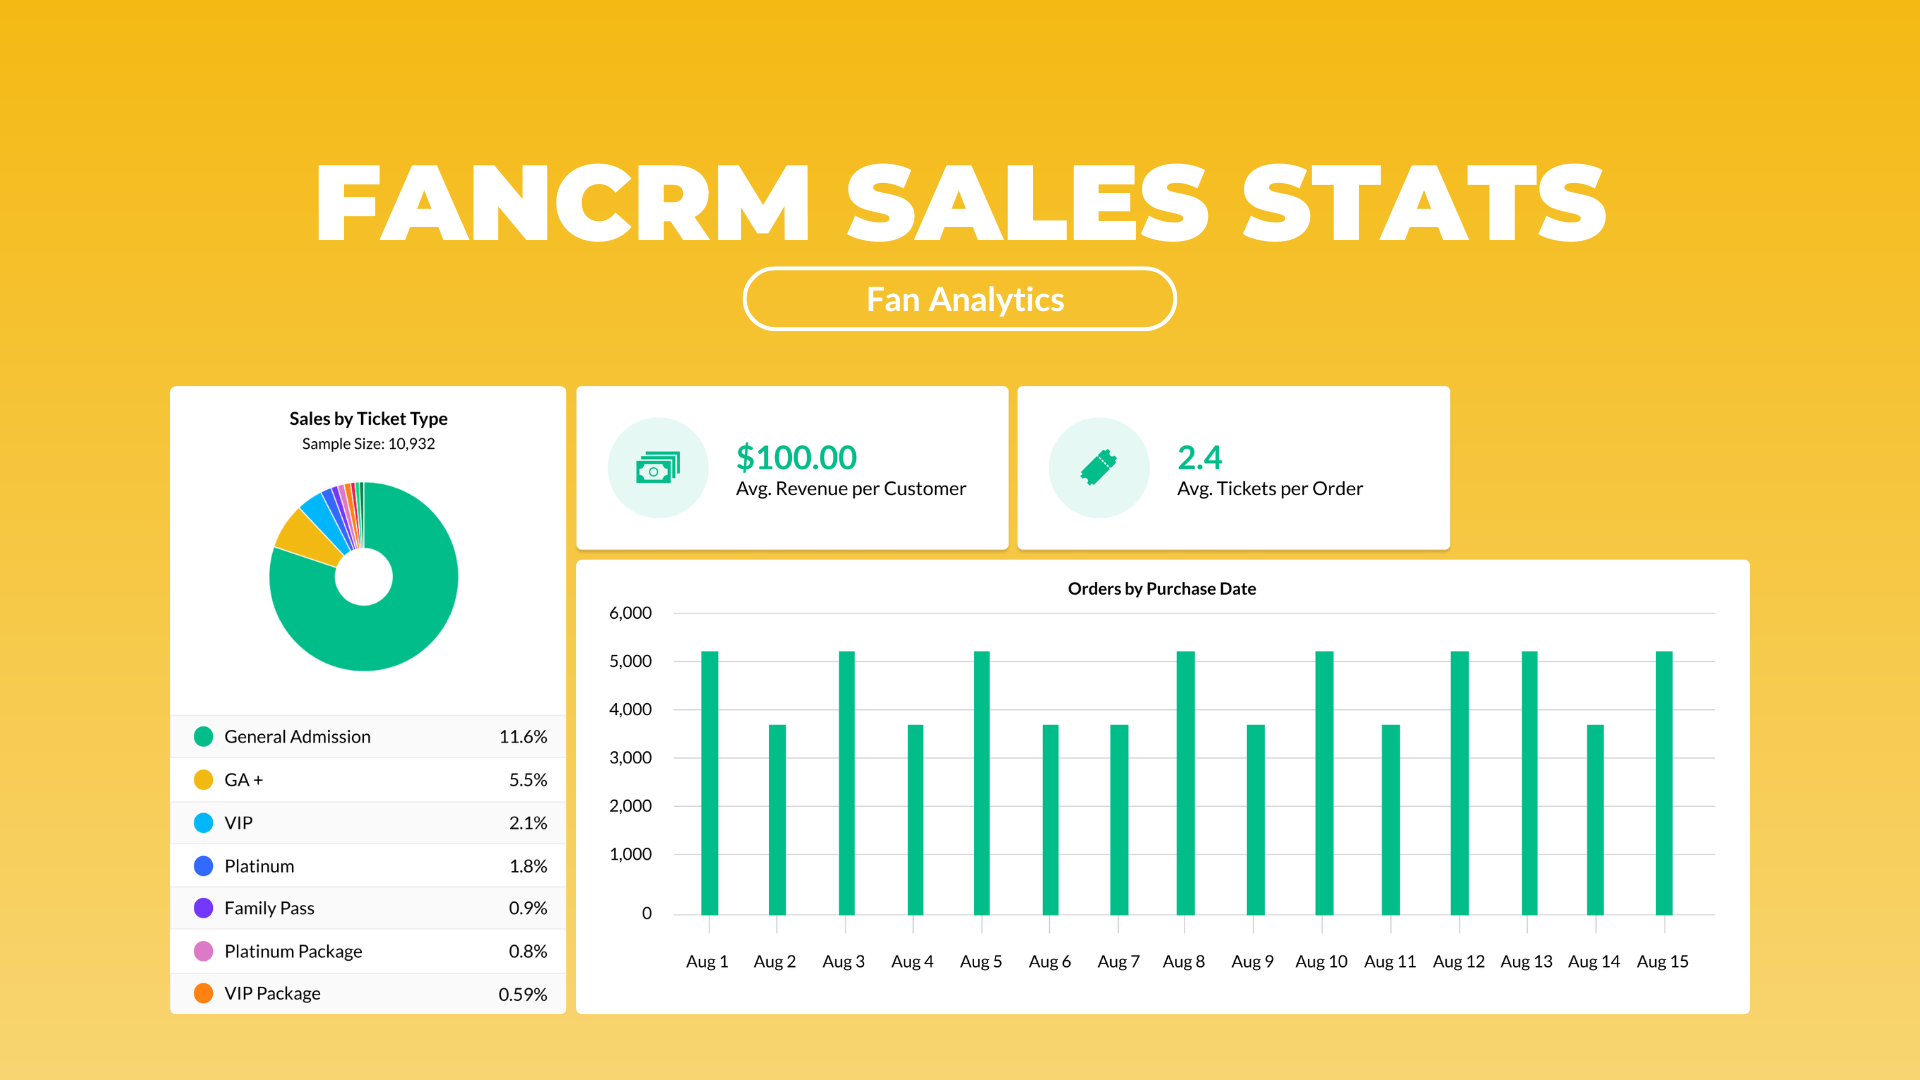
Knowing your total revenue is useful. Knowing how fans buy - what they spend on average, how many tickets they grab per order, which ticket types move - is the kind of information that actually provides some insights. Before now, that detail lived outside the platform.
What's new:
Four additions to the Sales Stats accordion in FanCRM > Stats:
If you've already got sales data connected, these numbers are populated and ready - nothing to configure, nothing to sync.
Why it matters:
Total revenue is great for telling you the size of your on-sale. These four numbers give you a better shape.
-
Average tickets per order flags whether fans are buying solo or in groups.
-
The purchase-date chart shows exactly when demand spikes.
-
Average revenue per order shows you how that money is distributed (a.k.a. $500K in revenue aggregate would look identical whether you had 500 high-value buyers or 5,000 more casual ones).
These new additions give you a deeper look at the layer underneath - how fans buy, what they tend to spend, and when on-sale spikes actually happen.
Things to know:
- Lives in FanCRM > Stats> Sales Stats accordion
- Populates automatically from any connected ticketing/sales data
- The two chart views (ticket type, purchase date) update live as new sales come in
Go take a look. If you've got sales data connected, these numbers are already waiting for you. Open FanCRM Sales Stats